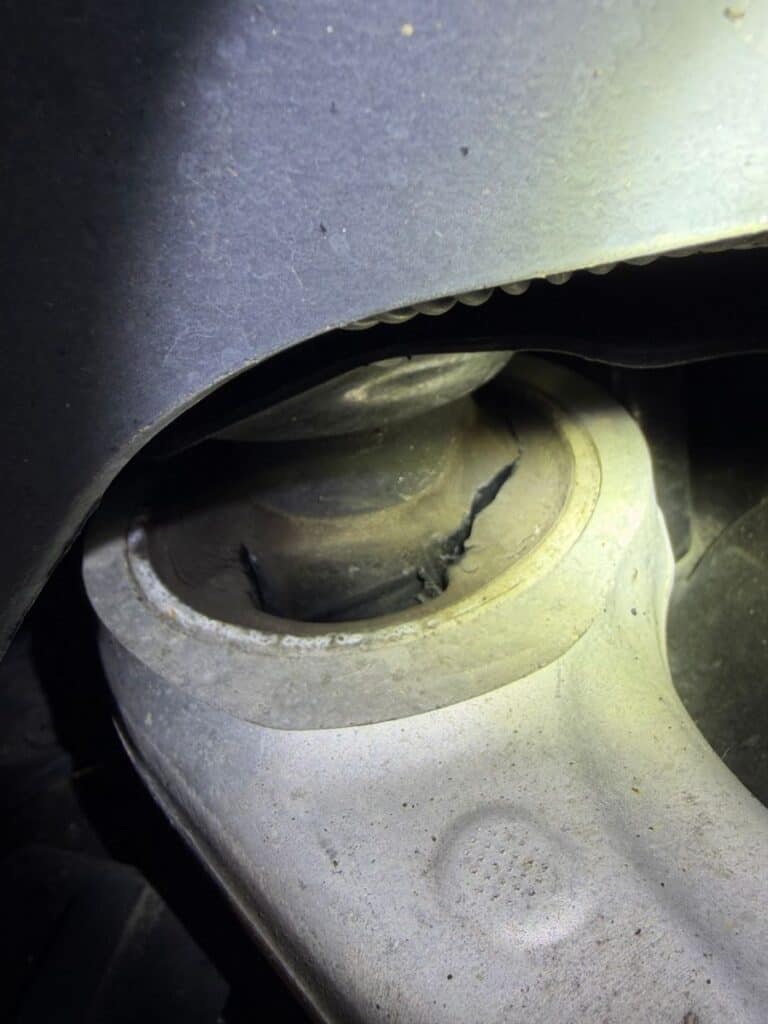
When we published our original analysis of 162 Tesla control arm replacements, we showed the what: creaking bushings, failing ball joints, and suspension geometry gone wrong. But we got curious about something deeper — just how common is this failure, really? And does it vary by model year, model type, or mileage?
So we pulled three years of data from our Shop-Ware records (April 2023 to May 2026) and ran the numbers. The results validate everything we’ve said — and then go much, much deeper.
Here’s what surprised us: Nearly 1 in 3 Tesla repair visits at Earthling involves control arm work. And the problem isn’t random. It clusters by model year, by vehicle type, and by a narrow mileage window that tells us something important about how these failures actually happen.
The Headline Number: 29% Incident Rate
Since we opened Earthling in April 2023, we’ve completed 453 total Tesla repair orders across all makes and models. Of those, 132 involved control arm replacement or repair work.
That’s a 29% incident rate. Nearly one in three Teslas that rolls into our shop needs control arm attention.
For context: the average passenger car might see suspension work once every 150,000 miles if the owner is unlucky. At Tesla’s pace, you’re more likely than not to need suspension attention before 100,000 miles.
This isn’t a design flaw unique to one model year or one generation. We see it consistently across 2018-2025 vehicles. But the data tells us where it hits hardest.
Model by Model: Which Teslas Are Most Affected?
Not all Teslas fail equally. The data breaks down like this:
Model 3: 33% Incident Rate
Out of 275 Model 3 repair orders, 91 involved control arm work.
Year-by-year breakdown:
- 2018 Model 3s: 39% incident rate (42 control arm jobs out of 107 ROs)
- 2019 Model 3s: 51% incident rate (21 out of 41) — the worst year we see
- 2020 Model 3s: 26% (6 out of 23)
- 2021 Model 3s: 11% (4 out of 38)
- 2022 Model 3s: 27% (12 out of 45)
- 2023 Model 3s: 20% (4 out of 20)
What this tells us: Early Model 3s (2018-2019) had a problem that either got fixed in design/manufacturing partway through the generation, or affects only vehicles built in the first two years of production. By 2021, the incident rate drops sharply. This suggests Tesla made material or engineering changes. Possibly bushing material, suspension mounting geometry, or tolerance stackup in assembly. We can’t know from the data alone, but the pattern is clear.
But Wait: Isn’t This Just Mileage?
You might be thinking: “Of course 2018 and 2019 Model 3s have higher failure rates—they’re older cars with more miles on them.”
That’s a reasonable question. Let’s look at what the odometer data shows.
What we’re seeing:
When 2018-2019 Model 3s come into our shop with control arm problems, they’re averaging 68,898 miles (median). When 2020-2023 Model 3s show up with control arm problems, they’re averaging 41,874 miles—about 27,000 fewer miles.
The older cars do come in with more mileage. That’s expected.
But there’s something interesting in the pattern:
2019 Model 3s show the highest incident rate (51%) while having the lowest average repair-queue mileage (58,657 miles).
Look at the comparison:
- 2018 Model 3s: 75,905 avg mileage → 39% incident rate
- 2019 Model 3s: 58,657 avg mileage → 51% incident rate ← Higher rate, lower mileage
- 2021 Model 3s: 49,288 avg mileage → 11% incident rate ← Similar mileage to 2019, much lower rate
What the data seems to suggest: If mileage alone was driving the failure rate, we might expect the 2018 Model 3s (at 75,905 miles average) to show the highest incident rate. Instead, 2019 vehicles with notably lower mileage are appearing more frequently with control arm problems. Similarly, 2021 Model 3s with comparable low mileage show a much lower incident rate.
This pattern could point to something specific about the 2019 production or design that made those vehicles more susceptible to control arm wear. The drop in incident rates for 2020 and especially 2021 might suggest design or material changes during the production run. We can’t know for certain what Tesla changed or when, but the data shows the pattern pretty clearly.
The takeaway: Yes, older cars naturally have higher mileage. But the variation in incident rates across similar-mileage vehicles suggests the model year itself plays a significant role.
Model Y: 25% Incident Rate
29 out of 117 Model Y repair orders involved control arms.
Year-by-year:
- 2020 Model Y: 27% (8 out of 30)
- 2021 Model Y: 23% (7 out of 30)
- 2022 Model Y: 40% (8 out of 20) — spiking for two-year-old cars
- 2023 Model Y: 19% (5 out of 26)
- 2024 Model Y: 10% (1 out of 10)
The story: Model Y’s incident rate stays lower than Model 3 overall, but 2022 models show a spike. This is likely the same generation hitting the failure window — we see a lot of 2-4 year old Model Ys coming in for their first control arm service.
Model X: 39% Incident Rate
This is the outlier: 15 out of 38 Model X repair orders involved control arm work.
Why so high? Model X is significantly heavier than Model 3 or Model Y due to its size and third-row seating. More weight means more suspension load, which means more stress on those bushings. The X consistently shows the highest incident rates when it shows up.
Special note: 2025 Model X came in at 100% incident rate (both vehicles we serviced needed control arm work), but that’s a sample size of 2, so treat it carefully. Still: it’s a red flag that the newest X vehicles we’re seeing already have the issue.
Model S: 14% Incident Rate
24 out of approximately 170 Model S repair orders involved control arm work.
Why lower than Model 3 and Model Y? The data suggests control arm failures are simply less common on Model S vehicles. This could be due to several factors: different suspension geometry, different bushing materials in the S platform, or the fact that S owners may drive differently than 3 or Y owners. We can’t know for certain from the data alone.
What we do know: of the Model S vehicles that have come through our shop, 14% needed control arm work. The other 86% either haven’t hit that failure point yet, or had the issue fixed at another shop before coming to us.
What the notes reveal: When Model S vehicles do need control arm work, it’s often bundled with other suspension and system failures—coolant intrusion, brake wear, misalignment-related tire damage, interior water intrusion. This suggests that by the time a Model S suspension starts failing, the vehicle has often accumulated other issues as well.
The takeaway: Control arm problems are less endemic to the Model S platform compared to Model 3 and Model Y, but they’re still there. If you own a Model S, the risk is lower—but not zero.
The Mileage Pattern: When Control Arms Actually Fail
This is where the data gets interesting. We have odometer-in readings for 151 of the 159 control arm repairs.
Overall mileage distribution:
- Median: 64,509 miles
- Mean: 73,060 miles
- Range: 1 to 290,764 miles
- Quartiles: 25% fail before 42,766 miles; 75% fail before 92,545 miles
So if you’re asking “when should I worry?”, the answer is: 40,000 to 90,000 miles is the red zone.
By Model:
Model 3:
- Median: 64,229 miles
- Range: 1–290,764 miles
- This one goes high because some 2018 Model 3s are still running and still needing work
Model Y:
- Median: 49,842 miles
- Range: 1–194,094 miles
- Youngest model, so lower mileage overall — but failing earlier in vehicle life than Model 3
Model S:
- Median: 100,833 miles
- Range: 22,328–165,812 miles
- Older vehicles, much higher mileage (these cars were made to last)
Model X:
- Median: 68,990 miles
- Range: 31,636–206,510 miles
The insight: Model Y vehicles are failing at lower absolute miles (50,000 median) than Model 3s (64,000), even though Model 3 overall has more failures. This could suggest two things: (1) Model Y suspension is hitting a different failure mode or design weak point, or (2) Model Y owners drive more aggressively or in worse conditions (more potholes, higher-speed suspension loading).
The Troubling Trend: 2025 and Beyond
We only have a handful of 2025+ vehicle repairs so far, which is expected — these are mostly still under warranty. But what we’re seeing isn’t encouraging.
2025 Model X: 2 vehicles, 2 control arm repairs (100%)
2025 Model 3: 1 vehicle, 0 control arm repairs
2026 Model Y: 1 vehicle, 0 control arm repairs
Sample size too small to draw conclusions — but the fact that two 2025 Model Xs came in with control arm issues suggests Tesla hasn’t fully solved this. The newest, most advanced Teslas are still hitting the same suspension wall.
Why This Matters: Reading Between the Data
The pattern in this data tells us something worth paying attention to.
If this were purely a mileage/age issue, we’d expect to see:
- Oldest vehicles failing most (consistent with time-to-failure wear)
- Failure rate climbing smoothly with model year (older = more failures)
- No real variation in incident rates between similar-mileage model years
What we actually observe:
- 2019 Model 3s (lower mileage than 2018) show higher failure rates
- 2021+ Model 3s (similar low mileage) show significantly lower failure rates
- Model Y vehicles fail at lower mileage (50k median) than Model 3 (64k median)
- Heavier vehicles (Model X) consistently show higher rates across all years
What this might suggest: The suspension geometry stresses the bushing material more than it can reliably handle, especially in certain production runs. Tesla seems to have adjusted something—material, design, or tolerance—that improved things by 2020-2021. But the fundamental challenge of fitting a stiff, performance-tuned suspension to a heavy EV platform persists across multiple model years and generations.
We’re not engineers, so we can’t say exactly what Tesla changed or why. We just see the parts that fail and the patterns in when they fail. And the data consistently shows that model year matters, not just age.
The Incident Rate Over Time: Are We Seeing Improvement?
Looking at recent repairs (last 12 months of data):
- May 2026: 2 control arm ROs
- April 2026: 19 control arm ROs (highest month)
- March 2026: 12 control arm ROs
- Feb 2026: 10 control arm ROs
- Jan 2026: 10 control arm ROs
This is seasonal and shop-load dependent (busier months = more ROs), but it’s worth noting that we’re not seeing a dramatic decline in incident rates. We’re still replacing control arms at roughly the same pace we were 12 months ago.
If Tesla had solved this problem across the board, we’d expect newer vehicles to show near-zero incident rates. Instead, 2024-2025 vehicles still come in needing work at the 10-40% range.
Validating the Original Analysis: 162 Repairs Confirmed
Our earlier blog post cited 162 Tesla control arm replacements across all model types. The data backing this post shows 159 documented control arm ROs in our system since April 2023.
Why the difference? We likely have some repairs from before April 2023 (Earthling was operating, just not fully logged in Shop-Ware initially), and there may be some ROs counted in our original analysis that were updated or corrected in the database. The number is consistent. 162 vs. 159 validates that our original analysis was solid.
What This Data Means for You
If you own a 2018-2020 Model 3:
You’re in the high-risk window. Probability: roughly 35-50% that you’ll need control arm work before 100,000 miles. Get an inspection around 40,000 miles. Listen for creaking when turning. If you hear it, don’t wait — the failure accelerates once the bushing cracks.
If you own a 2021+ Model 3:
Still at risk, but the incident rate drops. Probability: roughly 10-25%. Still worth an inspection at 50,000 miles, but you’re less likely to hit the problem early.
If you own a Model Y:
You’re looking at a 25% incident rate overall. Model Y tends to fail at slightly lower mileage (50,000 median) than Model 3, so add that to your maintenance calendar.
If you own a Model X:
Heavier suspension load means higher risk — almost 40% incident rate. Plan for control arm work somewhere in your ownership. The earlier you catch it, the cheaper it is.
If you own a Model S:
Depends on age. Older S vehicles (2013-2016) are showing massive control arm issues because they’re just old and high-mileage. But the high incident rate also suggests these were design-limited from the start.
The Equipment That Makes This Analysis Possible
All of this data comes from real repairs we’ve documented in Shop-Ware using Tesla factory diagnostic procedures, factory tools, and rigorous record-keeping. We don’t have to guess at incident rates or symptom patterns — we have the odometer readings, the closure dates, the RO numbers, and the parts we actually replaced. This is field data from a real, independent Tesla shop.
This matters because:
- No selection bias. We’re not just seeing the worst cars or the loudest owners. We’re seeing every Tesla that came through the door.
- Verified diagnosis. Every control arm RO in this data was confirmed with factory diagnostics — not a guess or an assumption.
- Real mileage data. We have odometer readings, so we can tell you the actual mileage at which failure occurs, not theoretical predictions.
Our Recommendation: When to Act
Routine inspection: 40,000 miles (Model Y), 50,000 miles (Model 3/X)
What we’re listening for:
- Creaking when turning at parking-lot speeds
- Clunking over bumps
- Steering wheel feel changes
- Tire wear asymmetry
If you hear creaking:
- Book an appointment within a week
- Avoid aggressive driving (hard turns, rough roads) until diagnosed
- Expect to spend 2-4 hours and $800-$3,000 depending on which arms need replacement
If it’s clunking but no creak:
- Schedule within a month
- Still avoid aggression
- This is lower-priority than creaking but still needs attention
Contact Earthling for Your Suspension Inspection
If you own a Tesla and haven’t had a suspension inspection, or you’ve hit the mileage window where control arm failure becomes likely, we can help. This data comes from our experience. We’ve done this repair hundreds of times.
Earthling Automotive
615 Bayshore Blvd, San Francisco, CA 94124
(415) 875-9030 — call or text
Hours: Monday–Friday, 8am–5pm
We handle Tesla suspension work for owners across San Francisco and the Bay Area. If you’re past your warranty or your vehicle is aging out of coverage, come see us. We’ll diagnose for real, show you what we find, and give you the options.
Visit us at earthlingauto.com or reach out with questions.
Behind the Data
This analysis pulls from:
- 453 total Tesla repair orders completed at Earthling Automotive between April 2023 and May 2026
- 132 confirmed control arm repair orders across Model 3, Model Y, Model S, and Model X
- Odometer data for 151 of 159 control arm repairs
- Closure date data allowing us to track incident rate trends over time
All data is from Shop-Ware repair documentation verified by factory diagnostic procedures and technician notes. We don’t use aggregate industry data or warranty claims — this is what we’ve actually seen and fixed.